May 2024: CDA Community Group Finishes Study
Coeur d'Alene Adaptation Project Releases Final Report & Will Present Findings at Local Conference
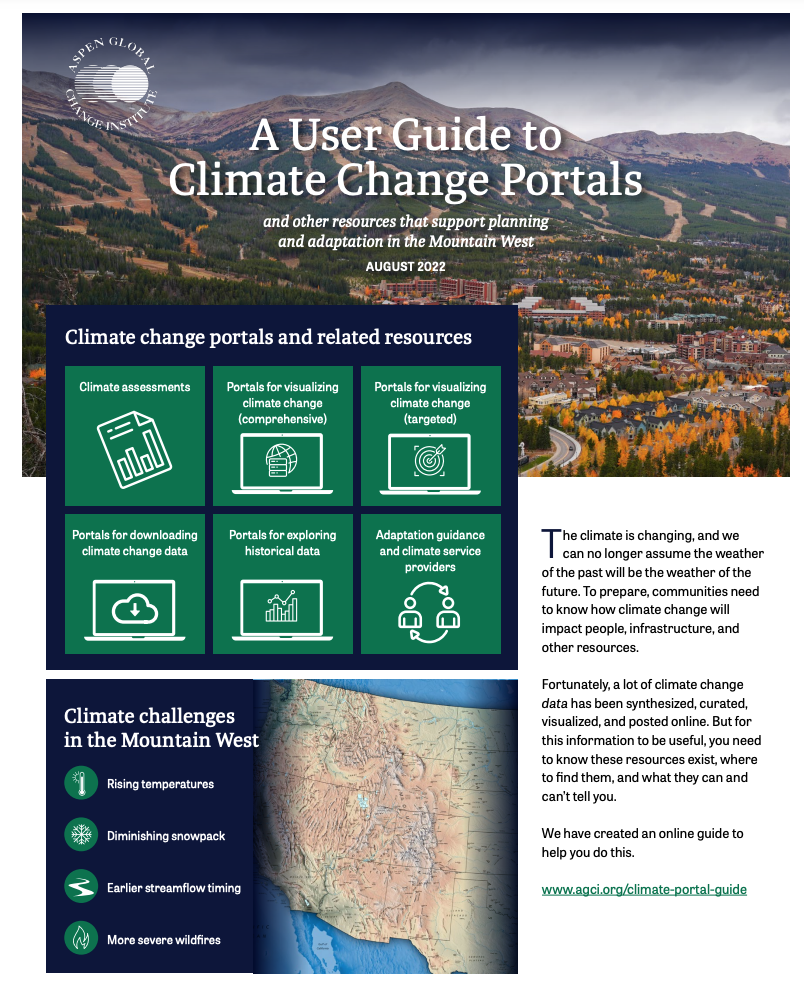
In 2020, community members in Coeur d'Alene, Idaho formed a group interested in climate impacts on the CdA lake and surrounding areas and what could be done. They called themselves the Couer d'Alene Adaptation Project (CCAP) and met regularly. They initially found inspiration from their neighbors in Spokane, Washington with the work of the Spokane Climate Adaptation Project . Both groups used the Climate Toolbox to draft an adaptation document as a start to thinking about future climate projections and projected impacts.
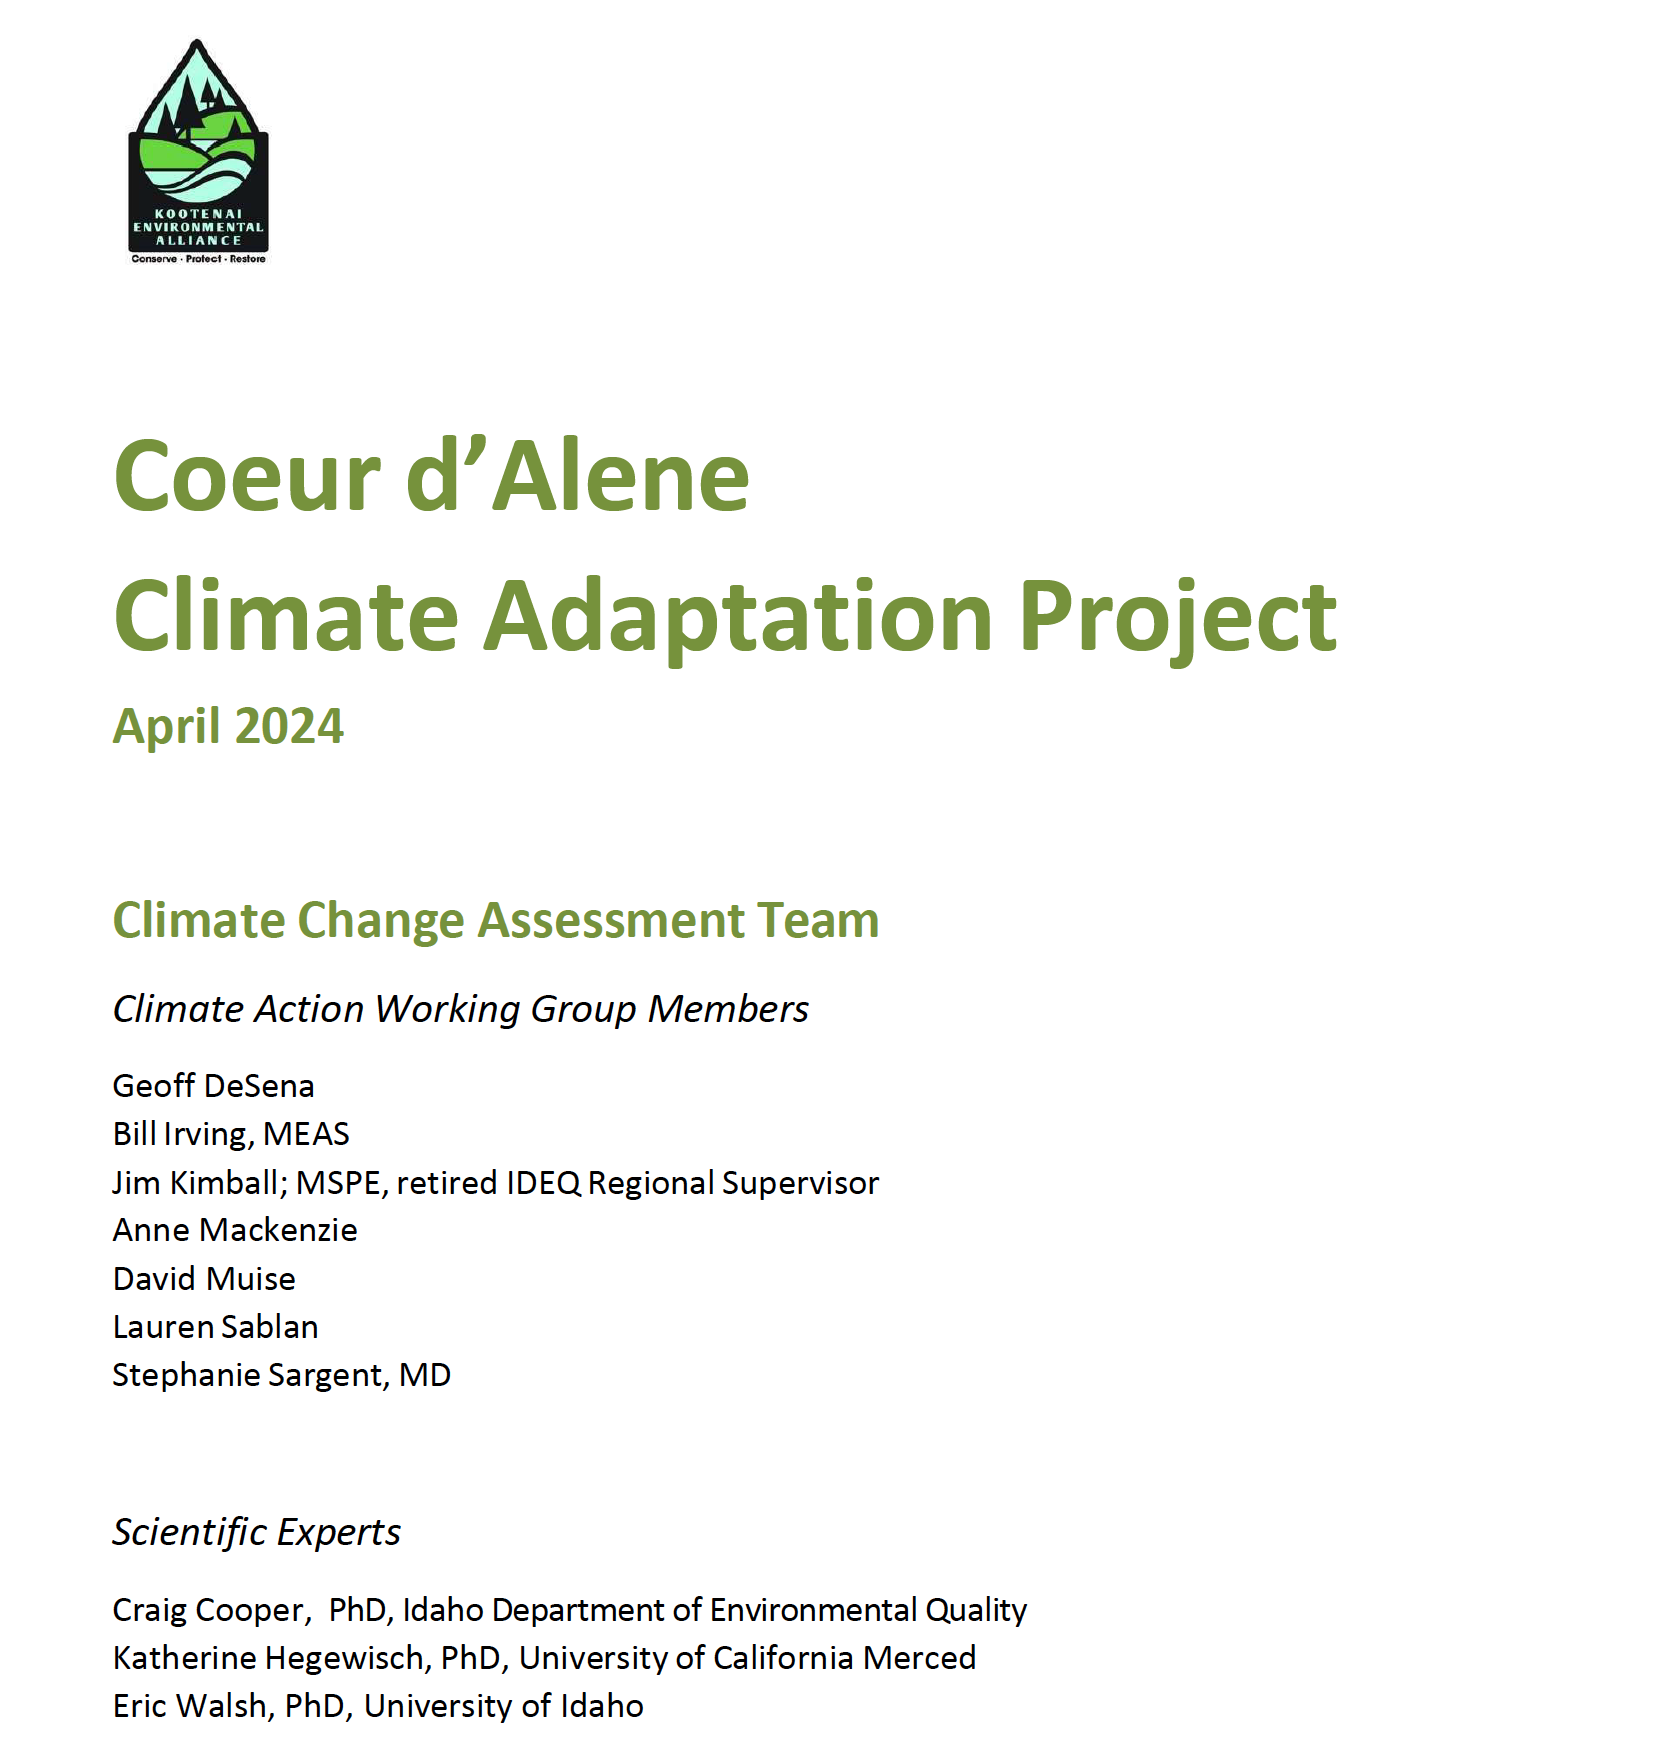
The Coeur d'Alene Adaptation Project has now finalized and is publishing their adaptation report. Team members (Dave Muise, Craig Cooper and Bill Irving) will be giving a presentation at the 1st Annual North Idaho Green Summit held May 18, 2024 in Coeur d'Alene, ID. This event is sponsored by the Kootenai Environmental Alliance (KEA).
The KEA will continue the work for climate action in the region with the KEA Climate Action committee.