This workflow describes the process to visualize and quantify future climate change uncertainty, select plausible and divergent climate scenarios, extract quantitative summaries for a large suite of climate and hydrological metrics for those scenarios, and use various tools available in Climate Toolbox to visualize spatial or temporal trends for the selected scenarios.
Step 1: Explore Uncertainty Space & Select Future Climate Scenarios
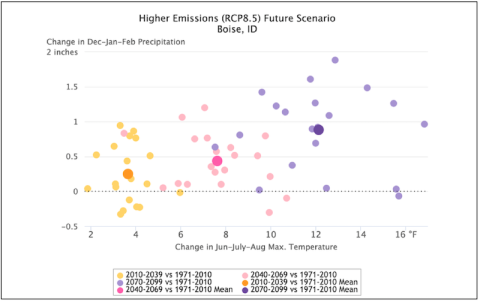
Use this tool to make an XY scatter plot to visualize the range of projections across two variables (e.g. temperature vs. precipitation). The scatter (uncertainty) in future climate projections can visualized using different emissions pathways and time periods. A large suite of climate and hydrological metrics are available to choose from with many variables also available on a seasonal basis. Select a model or set of models that represent specific vulnerabilities of your system of interest. For example, a model may represent a ‘Hotter, Wetter’ scenario or a ‘Hotter, Drier’ scenario. Use the “Scenario Table Results” to keep track of your selected models. Typical scenario-based assessments tend to select 3-5 climate scenarios to incorporate future climate change uncertainty into impact assessments and planning.
Tool: Future Climate Scatter
Explore Uncertainty Space & Select Future Climate Scenarios
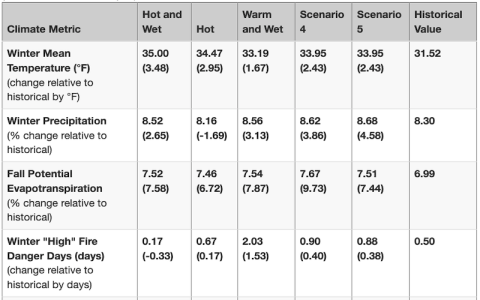
Step 2: Extract Summaries of Future Climate Scenarios
Use this tool to generate a summary of future projections for climate metrics of interest for your selected model(s)/scenarios. The output is a table (as .png or .csv) of model projections across a set of future climate scenarios and climate metrics that you enter. You can also output a table for all available metrics. This tool also outputs spatial files (as netcdf or Geotiff) for the selected variables.
Tool: Future Climate Scenarios
Extract Summaries of Future Climate Scenarios
Step 3: Explore More Model Projections
These tools can be used to further explore the projections of your selected model/scenario.
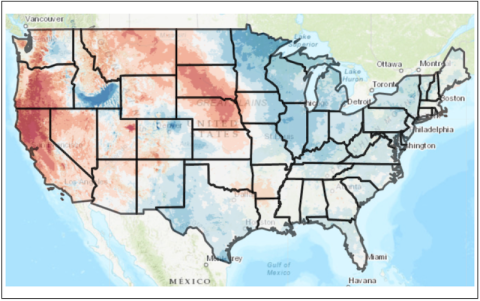
Tool: Climate Mapper
Visualize future climate projections in a map format.
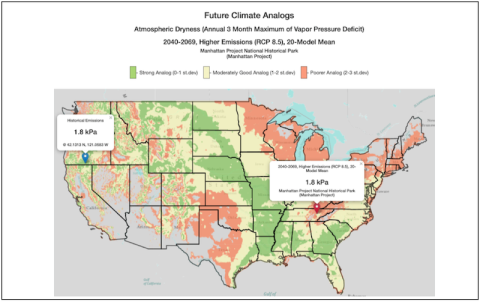
Tool: Future Climate Analogs
Identify locations with current climate conditions similar to future projections for a focal area.
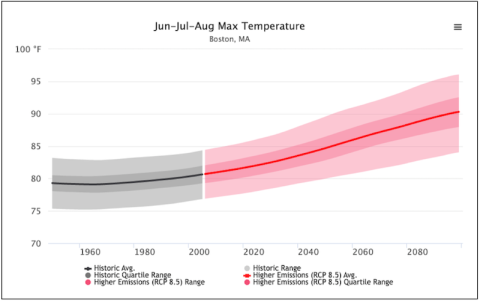
Tool: Future Time Series
Explore future climate changes over time.
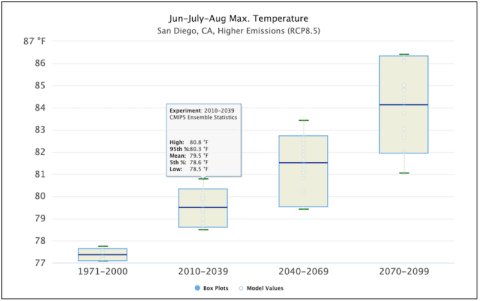
Tool: Future Boxplots
Create boxplots representing the range of future projections for a single climate metric.