NEWS

May 2024: Upcoming Sagebrush Workshop

Sagebrush-Training-Final.png

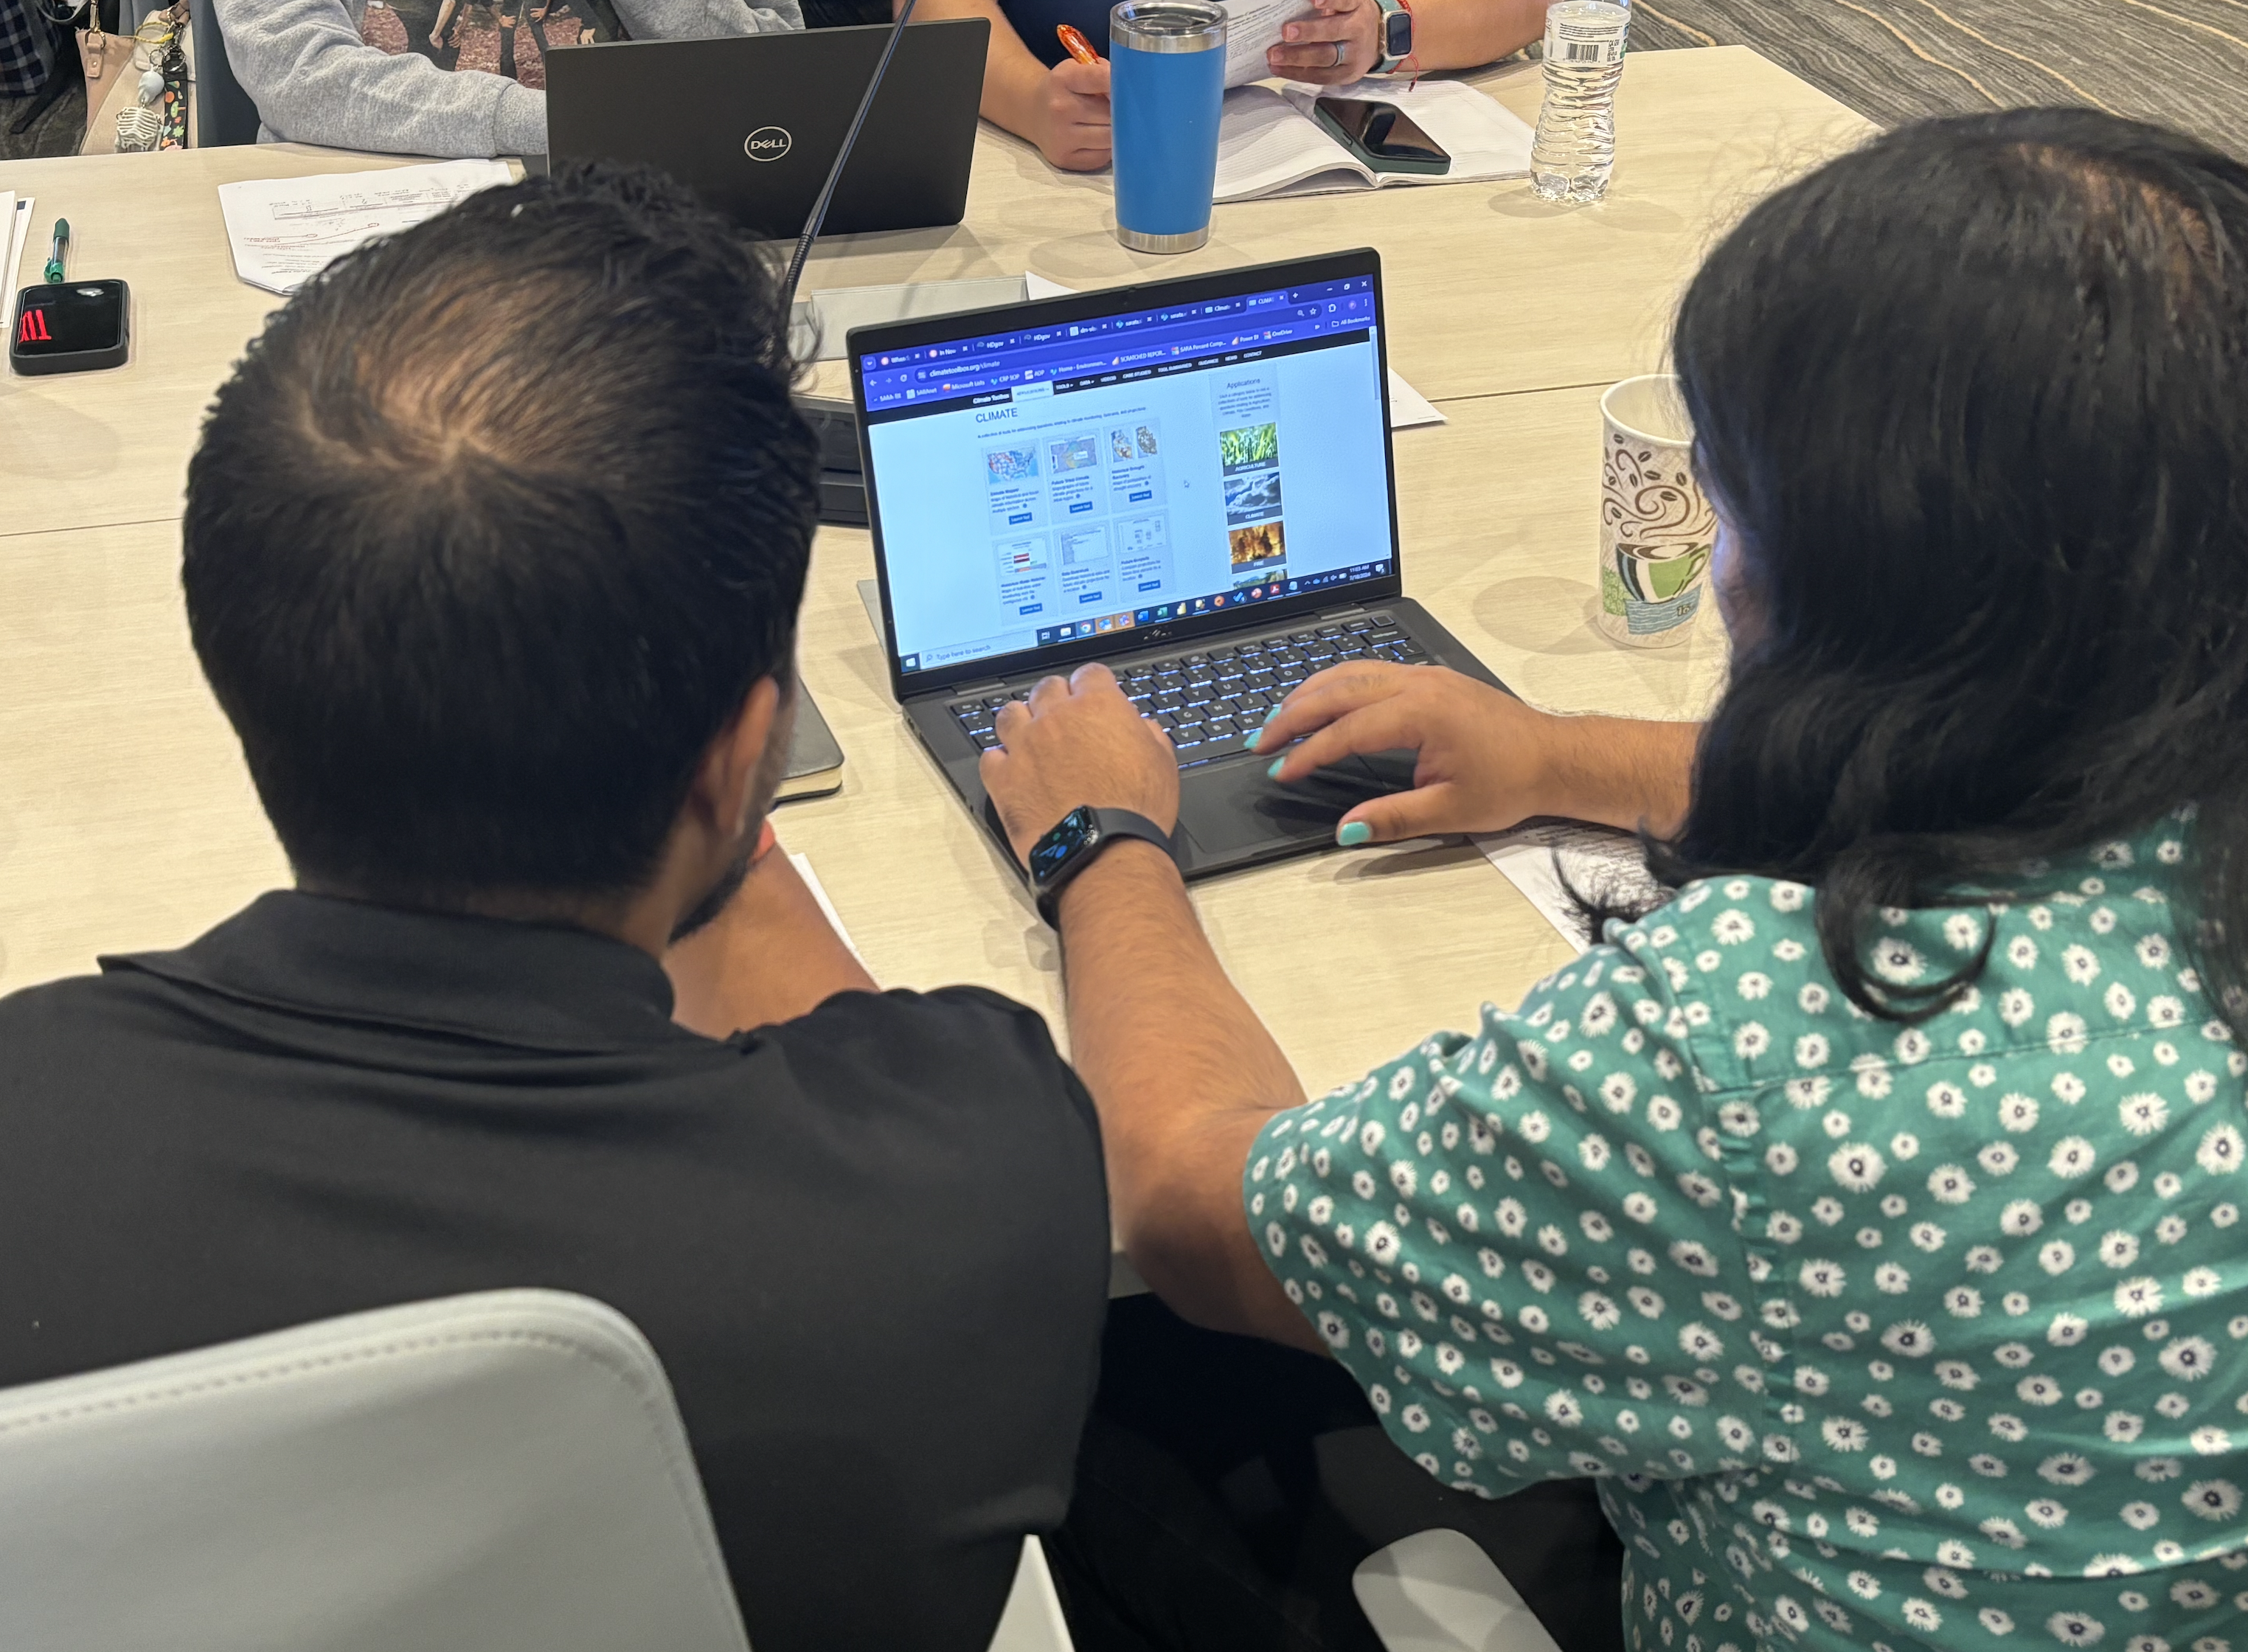
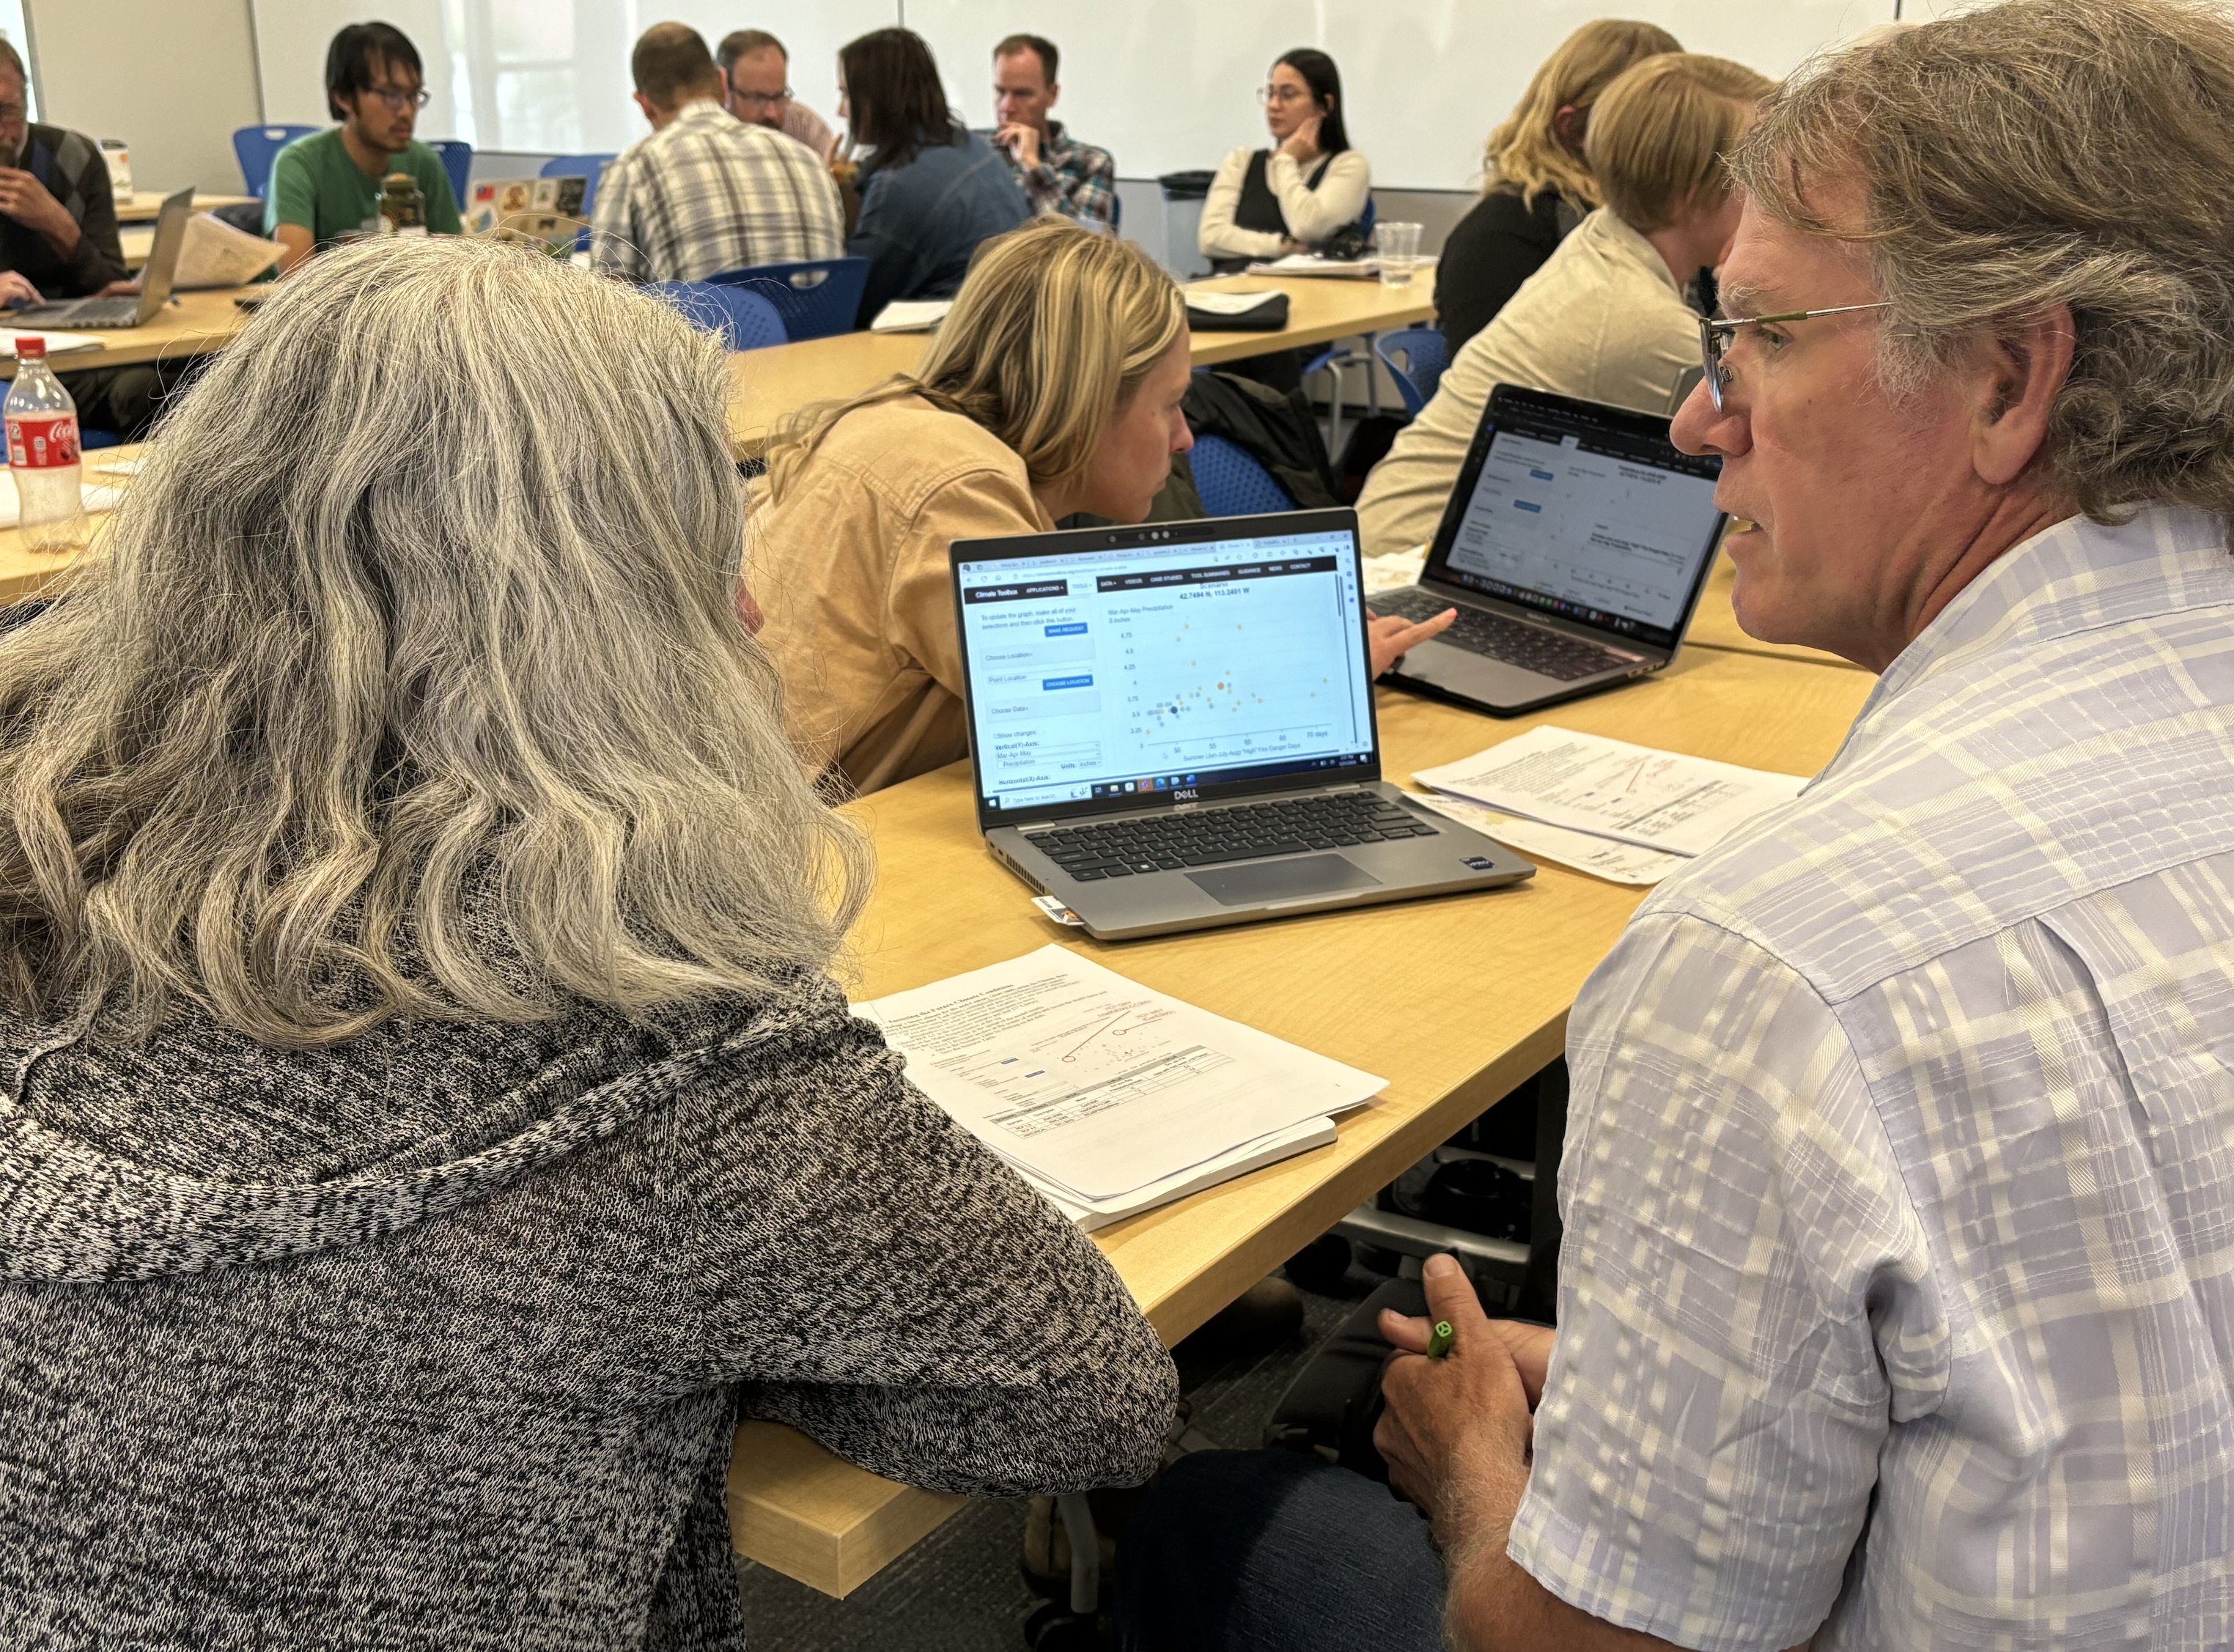
Training for Sagebrush Conservation Practitioners
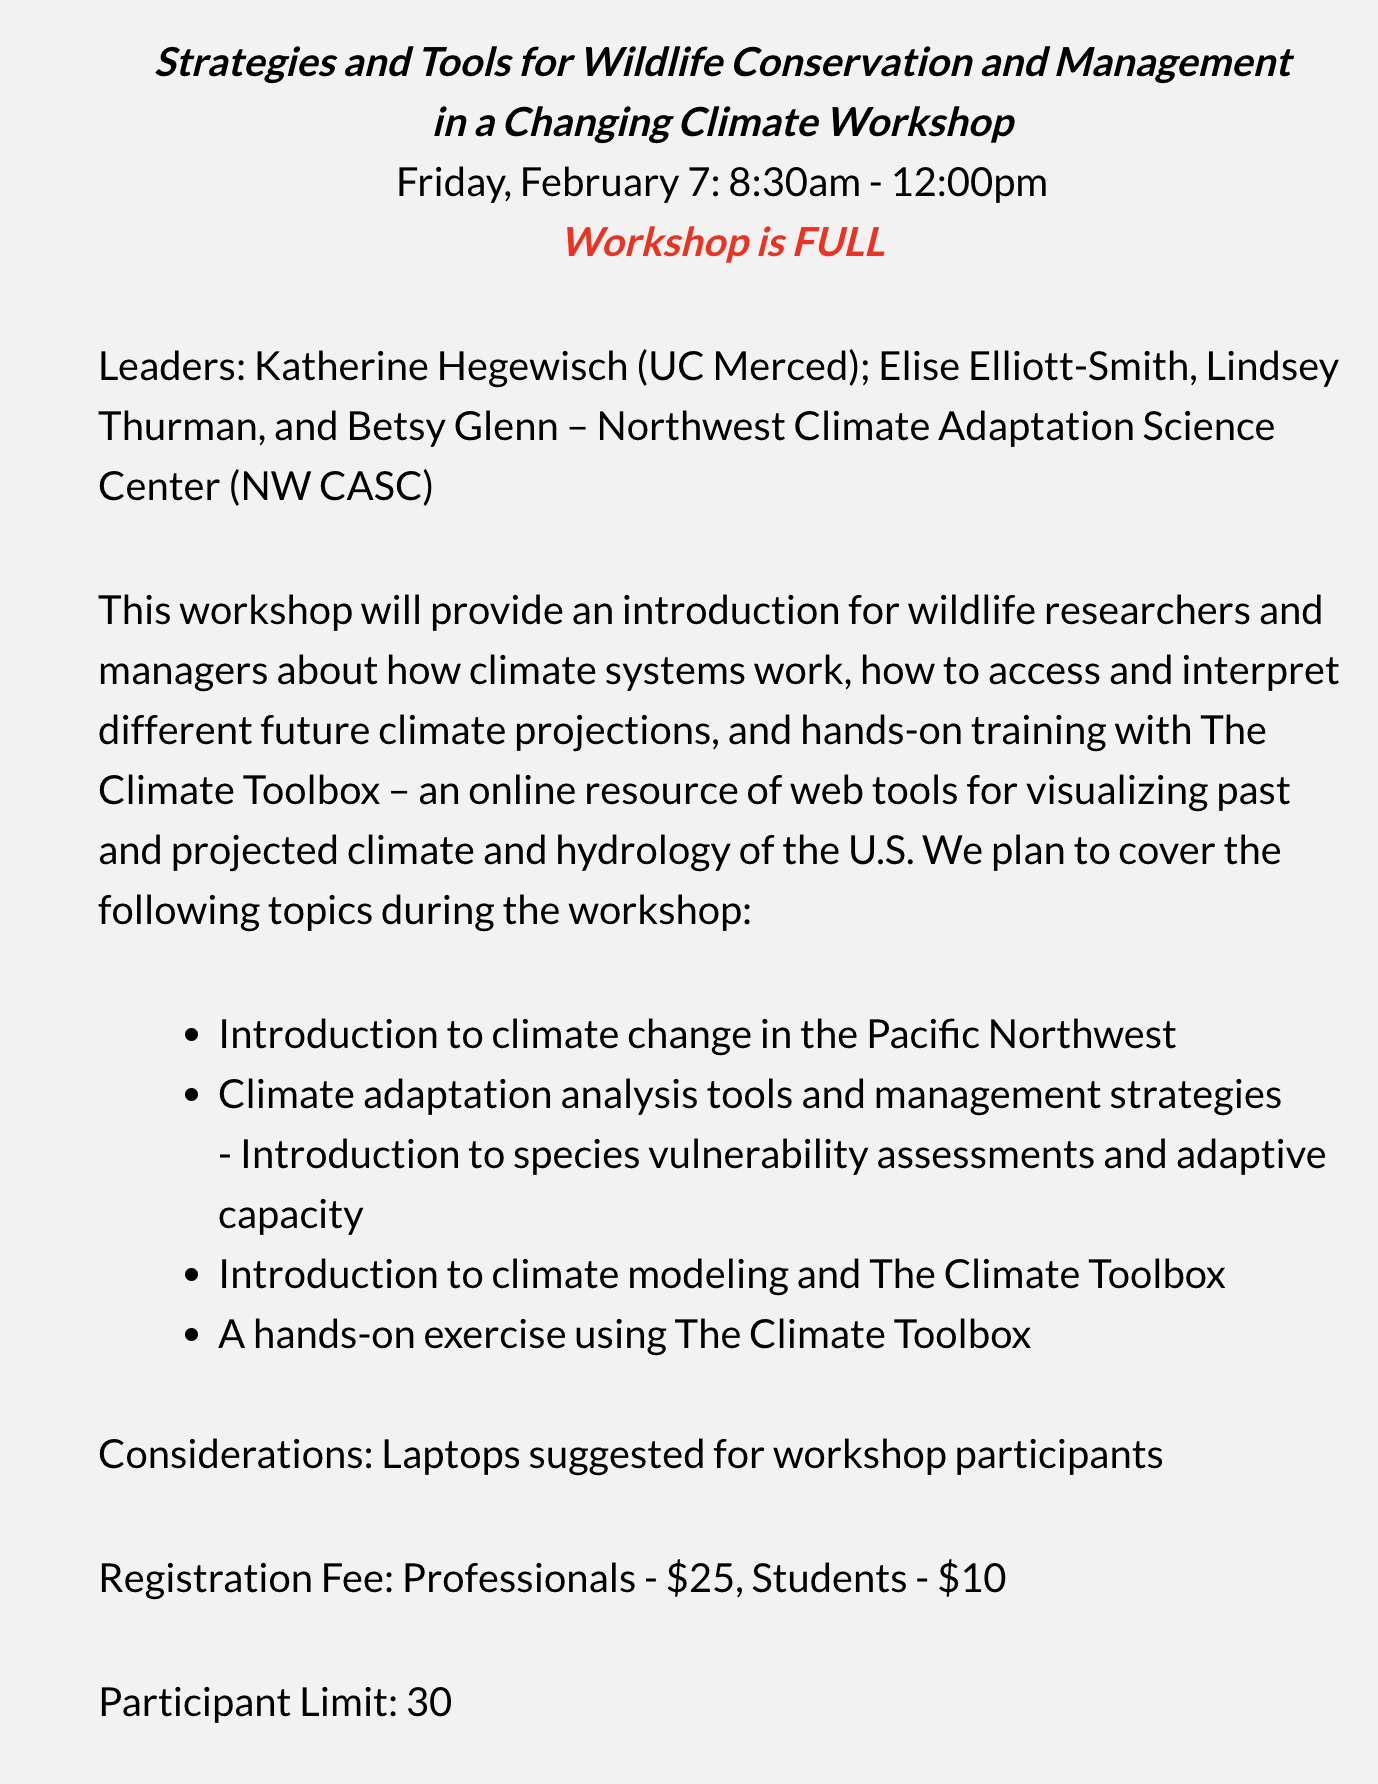
There is an upcoming workshop which will feature the Climate Toolbox amongst other tools.

The FWS Science Applications Program is working in partnership with multiple USGS Climate Adaptation Science Centers (CASCs), including the South Central CASC, Northwest CASC, North Central CASC, and Southwest CASC, and Boise State University, to develop a training series for sagebrush conservation practitioners.

These trainings will begin in February 2024 with a self-paced introductory course, a series of virtual classrooms, and an in-person workshop in Boise, ID May 21-22 2024. This training series is open to the U.S. FWS Sagebrush Ecosystem Team, as well as others who work in sagebrush ecosystems. Virtual sessions are open to anyone who may be interested.

The Climate Toolbox will be featured in the 90-minute online webinar, Introduction to Climate Tools, on April 30, 2024 at 1 pm Mountain time/ 12 pm Pacific time and there will be interactive hands-on exercises featuring tools in the Toolbox at the in-person workshop in Boise, ID on May 21-22, 2024. 

REGISTRATION AND INFORMATION

Feb 2024: Natural Resources Workshop in Kansas

Kansas Workshop

Climate Workshop at 2024 Kansas Natural Resources Conference

At the 2024 Kansas Natural Resources Conference in Manhattan, KS on Feb 8, 2024, there was a 4-hr workshop entitled 'Using Climate Data to Achieve your Natural Resources Objective'.

As part of this workshop, Christy Miller Hested (North Central Climate Adaptation Science Center) led a 1-hr hands-on climate lesson, 'Applications of the Climate Toolbox for Resource Management', which provided an overview of the Climate Toolbox and its climate data and had participants use the Climate Analogs tool to tell future data stories around the Tall Grass National Prairie in Kansas.

Christy worked with Climate Toolbox developer Katherine Hegewisch to develop the workshop. For the workshop,  Christy adapted the Future Temperatures 2-pager in the Climate Toolbox Workshop Series to look at the future of the Tall Grass Prairie through climate analogs.


Jan 2024: What's New in the Toolbox

Recent additions to the Toolbox:

  • Annual summary data for growing degree days, last spring freeze, first fall freeze and growing season length, heating degree days and chilling degree days were updated for all years 1979-2023 consistent with the current state of the gridMET database in the Historical Climate Tracker and Historical Climate Scatter tools.  
  • Annual summary data for chill metrics was added to the Historical Climate Tracker tool. These are in beta, so we welcome any feedback on these. 
  • Grids for the gridded data in each tool can now be shown by clicking a button under the location setter. This should be available in just about every single tool. 

Jul 2023: What's New in the Toolbox

Recent additions to the Toolbox:

  • Custom area-averaging- users can now either draw a polygon or choose a polygon from an uploaded shapefile to be used for area-averaging of data for some of the tools. Currently, this is only available in the Future Climate Scatter tool, the Future Boxplots tool and the Future Climate Scenarios tool... but we will be putting this option in most of the graphing tools soon. 
  • Customing colors in the Future Timeseries tool - the ability to change the colors on the graph has been added to the Future Timeseries tool. Just click the 'Change Graph' settings on the right of the tool to open the settings for modifying the colors.
  • Activity Series - a new Climate Toolbox Activity Series has been added to the toolbox in six lessons on climate impacts. 
  • A new Historical Drought Recovery tool - a new tool has been added the to the Toolbox. The Historical Drought Recovery tool allows you to create a map of the probabilities of recovery from drought. 

June 2023: What's New in the Toolbox

Recent additions to the Toolbox:

  • Future Climate Scenarios tool - a new tool has been added to the Toolbox. The Future Climate Scenarios tool allows you to create a table of climate projections with many different metrics and future scenarios. 
  • Future VPD  - vapor pressure deficit projections have been added to the Future Boxplots and Future Scatter tools.
  • Future hydrology projections  - a new hydrology dataset (MWBM by Hostetler & Alder which utilizes MACAv2-METDATA) has been added to the following tools: Climate Mapper, Climate Scenarios, Future Boxplots and Future Scatter.  This dataset has metrics of runoff, snow water equivalent, soil moisture and climatic water deficit at 1/24-deg over the contiguous USA.
  • Future climate scatter - a new feature has been added to the existing Future Climate Scatter tool that allows you to record information about clicked scatter points into a table. Open the 'Scenario Table Result' window in this tool to get started. 
  • Area averaging - area averaged data is available for most location based tools now where the area averages can be chosen from rectangular regions, US counties, US HUC8 watersheds and US states. There are more improvements coming soon for area averaging.
  • Educational Assignment - three assignments that utilize the Climate Toolbox for university teaching have been added. See Guidance
  • Video Training Series  - a series of training videos on the Climate Toolbox have been added to a YouTube channel. See Videos.

California Drought Stripes

CA Drought Stripes

California's Drought Stripes

The Los Angeles Times is displaying California's Drought Stripes on their newest Drought Tracker page.

The Drought Stripes are made from real-time data aggregated over California of the standardized 1-year water balance (precipitation minus potential evapotranspiration) data (a.k.a 1-year SPEI) from the Drought Stripes tool in the Climate Toolbox. 

SEE TRACKER

January 2023 Workshop

Grasslands Workshop

'How to Use the Toolbox' for Grassland Managers

In Jan 2023, the Climate Toolbox was utilized in a 2-day Grasslands workshop (Lakewood, Colorado) for US Fish and Wildlife and BLM land managers in District 5 & 6.

On day 1,  Katherine Hegewisch,  Imtiaz Rangwala and John Guinotte presented a 75-minute introduction to the Toolbox illustrating how to use the toolbox for future scenario planning related to biological species. 

On day 2, participants broke into groups looking at one of two grassland species: the regal fritlilary (a butterfly) and the grasshopper sparrow (a bird). Participants used the Climate Toolbox's Future Scatter tool to identify climate models of interest for each species and the Future Climate Scenarios tool to gather future projection information from the specific scenario models. Using this information, they discussed and brainstormed land management solutions that might work into the future with each species within the Resist-Accept-Direct (RAD) framework. 

SEE ACTIVITY

October 2022 Workshop

Students at Workshop

Climate Data Stories for Portland, Oregon

In Oct 2022 at the 25th annual ENVX symposium at Lewis and Clark College in Portland, OR, Katherine Hegewisch presented a 1.5 hour hands-on workshop entitled 'Using maps and graphs from the Climate Toolbox to create climate data stories'. In this workshop, students broke into groups of 2-3 and worked on one of six climate data activities created for the workshop. A representative from each group then gave a 5-min presentation on their climate data story. The activities walked students through data stories related to Portland's future fire danger, forests, grape growing suitability, streamflow for drinking water, wolverine habitat and temperature climate analogs. 

SEE SYMPOSIUM DETAILS    SEE ACTIVITIES

August 2022 User Guide

User Guide to Climate Change Portals

User Guide to Climate Change Portals

In Aug 2022, the Climate Toolbox was featured in the Aspen Global Change Institute's newest User Guide to Climate Change Portals. This guide aims to provide a first introduction to the vast and growing set of climate data portals that serve as resources to support planning and adaptation for the Mountain West. The Climate Toolbox is named as one of three of the 'most comprehensive sites' out there which are 'user-friendly and versatile' for exploring historical climate data and/or future projection climate data. 

SEE PORTAL GUIDE    SEE ADVERTISEMENT    SEE WEBINAR

September 2021 CIRCulator

Case Study Series   Drought Case Study

Highlighting applications of climate tools for decision-making

In this September 2021 CIRCulator, the Climate Toolbox introduces two new series of documents that increase accessibility of the Climate Toolbox: the Climate Toolbox Summaries series, which provides overviews of tools, and the Climate Toolbox Case Studies series, which highlights how users are applying the tools to decision-making. The documents in both series are straightforward, two-page summaries that are available for viewing and downloading from the Climate Toolbox website.

SEE ARTICLE    SEE TOOL SUMMARIES    SEE CASE STUDIES