NEWS

Jan 2025: What's New in the Toolbox

Recent changes to the Toolbox:

  • Predictive Service Area (PSA) boundaries have been added as layers in the Climate Mapper and for area averaging of data in all of the graphical tools that offer area averaging over other regions. In the Climate Mapper, you can add these new layers by clicking on 'Add Map Features' and then checking the box next to 'US Predictive Service Areas (PSAs)'. The boundaries will then show up on the map over CONUS.  
  • Future SPEI has been added to the Future Timeseries tool. SPEI is the standardized precipitation evapotranspiration index, a commonly used index for looking at drought. Now one can see the projected change in SPEI over some different seasons. 
  • SnowClim has been added to the Climate Mapper. This is a data product is over the Western USA and has future projections for summaries of snow such as days of snow cover, maximum snow water equivalent(SWE) and dates of maximum SWE and start and end of snow cover. SnowClim can be accessed by choosing Time Scale: Future Projections (through 2100) and Impact Area: Snow (Western USA, SnowClim, CMIP5).

Aug 2024: What's New in the Toolbox

Recent changes to the Toolbox:

  • Seasonal forecast models have been updated to the current operation NMME models. CanCM4i has been replaced with CanESM5. GEM5-NEMO has been replaced by GEM5.2-NEMO. GFDL_SPEAR and NCAR_CESM1 have been added. We now have 7 seasonal forecast models in the toolbox. 
  • We have had to remove the Drought Recovery Tool due to a problem with the UCLA VIC data stream that is not fixable. This product is not being maintained due to Dennis Lettenmaier retiring within the year. We are going to figure out how to replace the data stream to bring the Drought Recovery Tool back to the toolbox.
  • You can now add the annual timeseries for a specific CMIP5 model to the Future Time Series tool. From 'Choose Data', just click the checkbox for 'add model time series'. 
  • A report of all available seasonal and annual data can now be made in the Future Climate Scenarios tool. You just need to click the buttons for 'Add all seasonal metrics to report' or 'Add all annual metrics to report'
  • A 'Climate Scenarios' workflow was added to the Applications in the Climate Toolbox. This workflow can be accessed in the tool by clicking the APPLICATIONS menu at the top of the tool and selection 'Climate Scenario Workflow'.
  • Saving of the data table in CSV format is now possible in the Future Climate Scatter tool. Once recording data is 'On' in the Scenario Table Results section of the tool, clicking a point on the graph will add data to the table. You can save the table by clicking the button labeled 'Save Table (CSV)'.

July 2024: San Antonio River Authority Workshop

SARS workshop

Training for San Antonio River Authority Managers

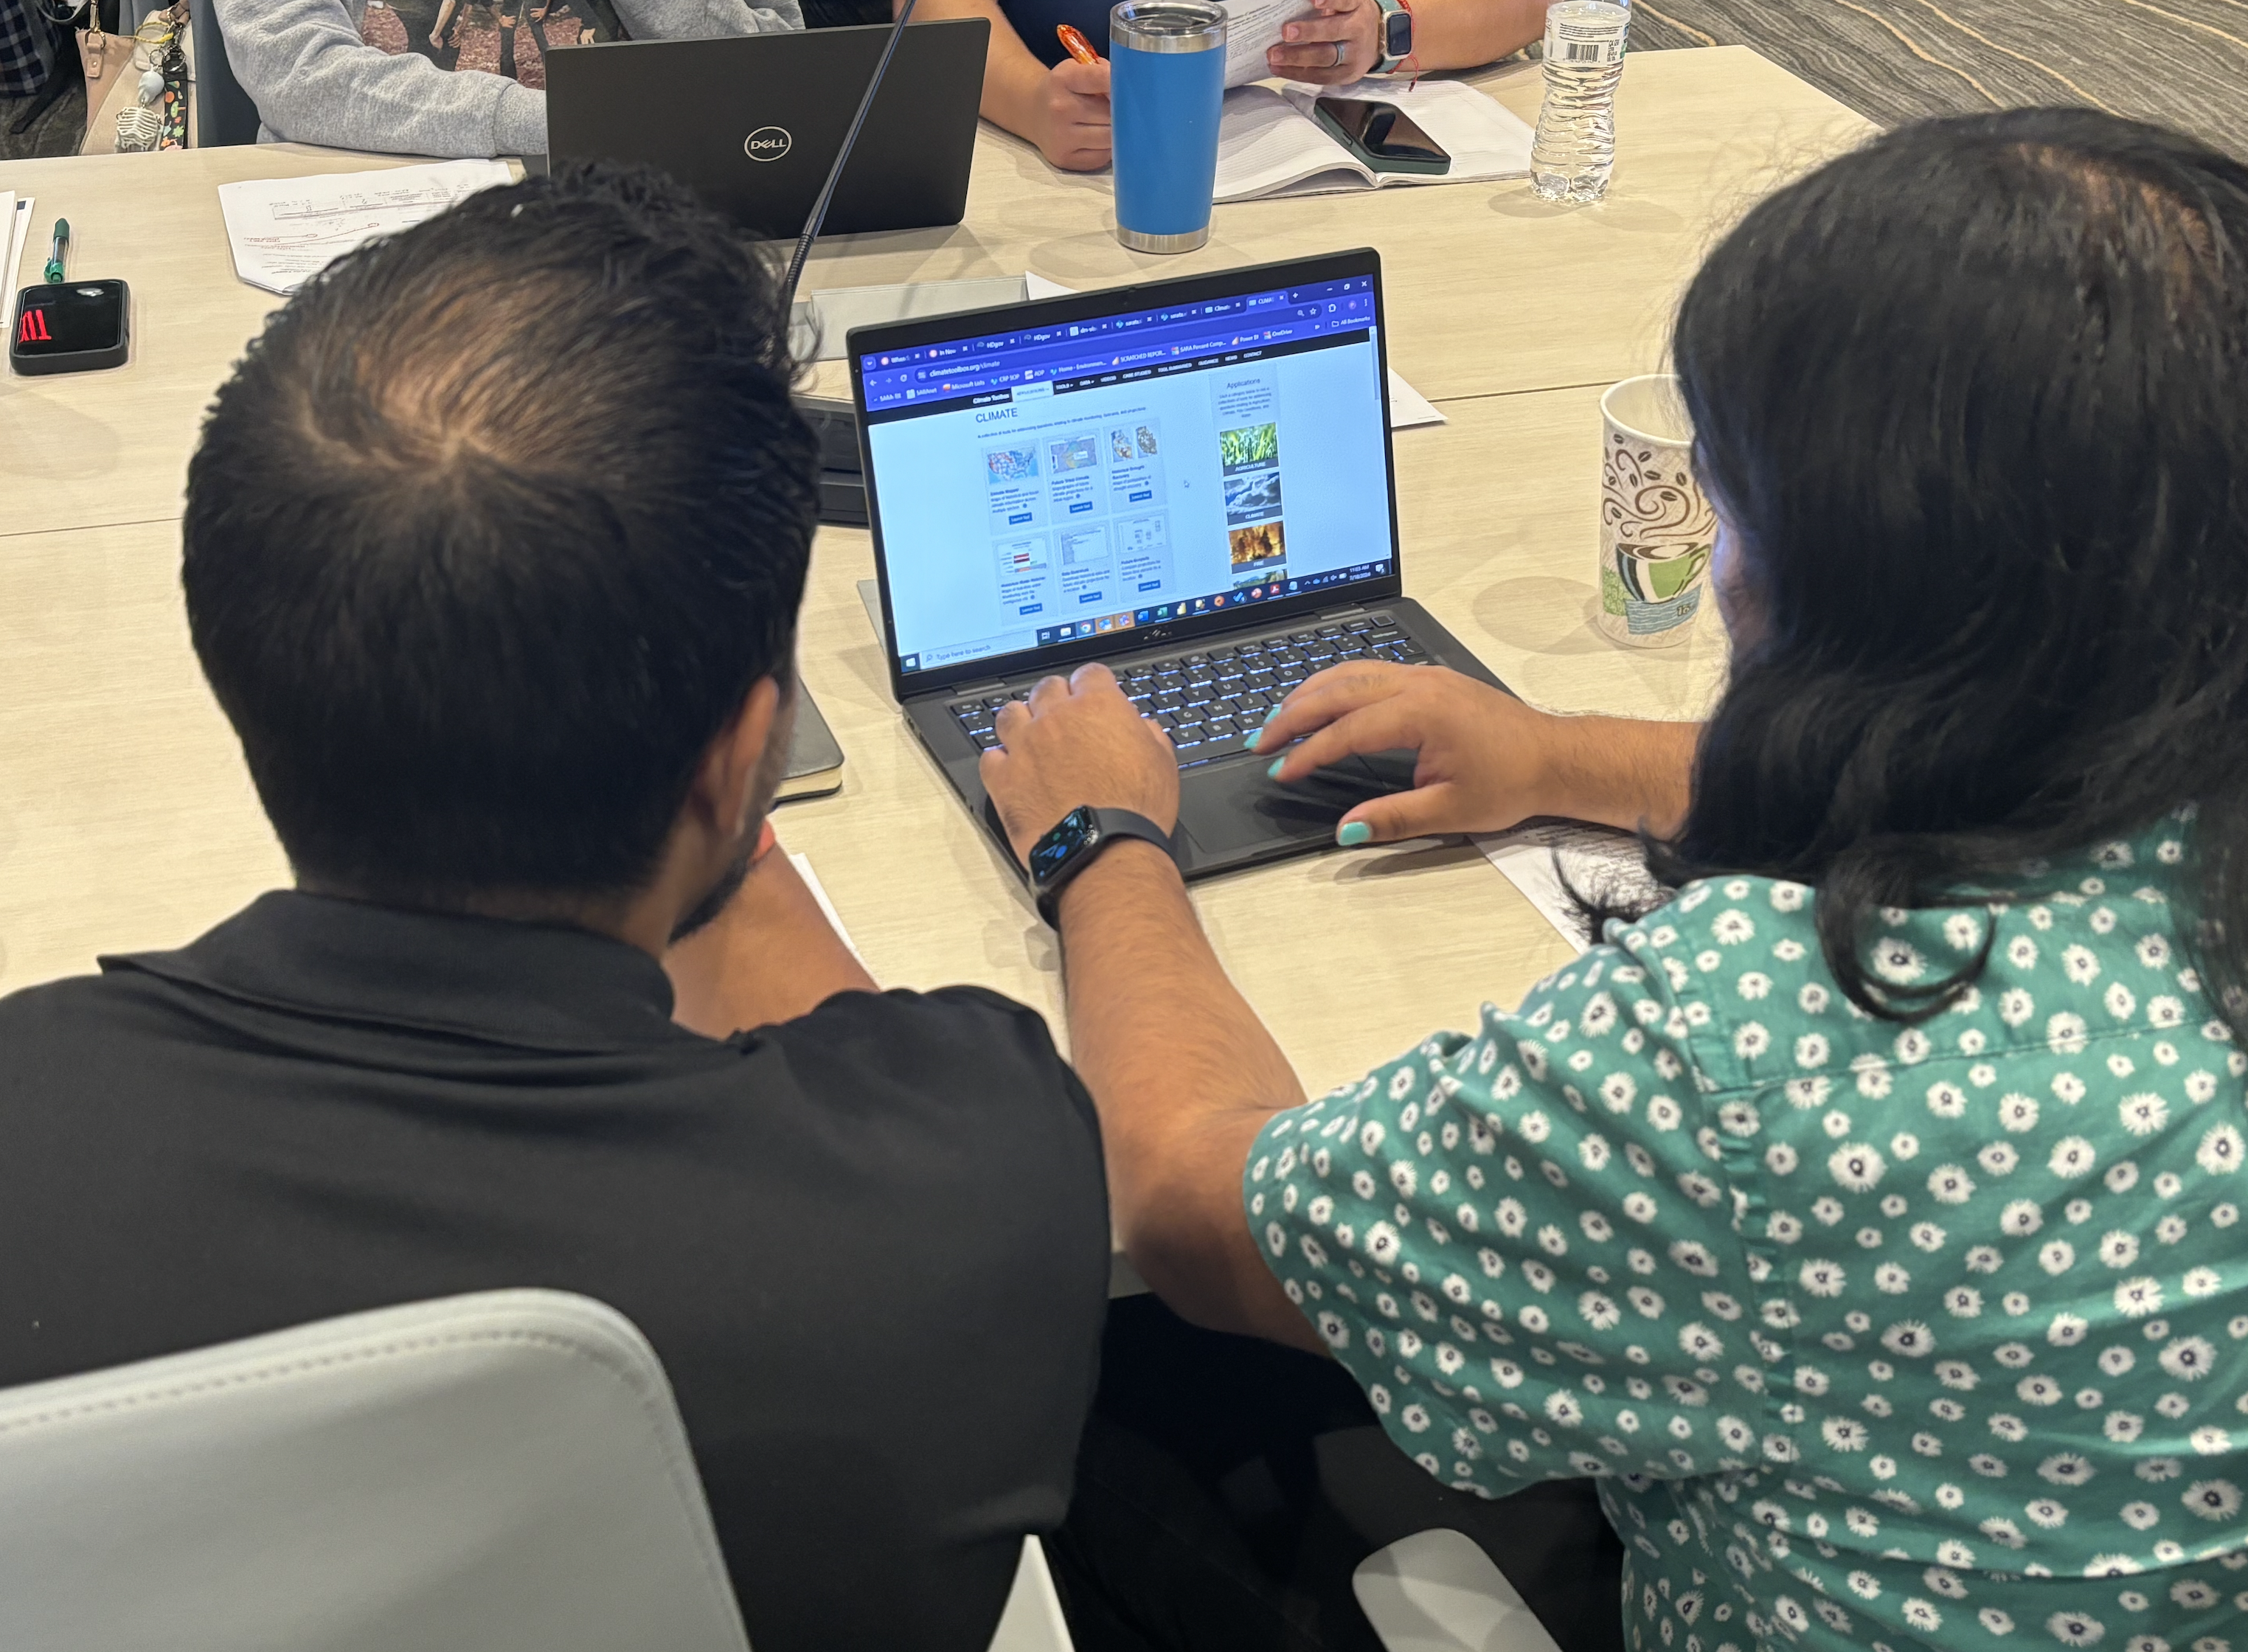
The South Central Climate Adaptation Science Center organized an interactive Climate workshop for the San Antonio River Authority from July 17-18, 2024 in San Antonio, TX.

The Climate Toolbox was featured in a 30-minute presentation by Katherine Hegewisch and in a hands-on exercise created by Emma Kuster (University of Oklahoma) similar to those exercises done at the Grassland and Sagebrush workshops.

May 2024: Sagebrush Workshop

Sagebrush Workshop

Training for Sagebrush Conservation Practitioners

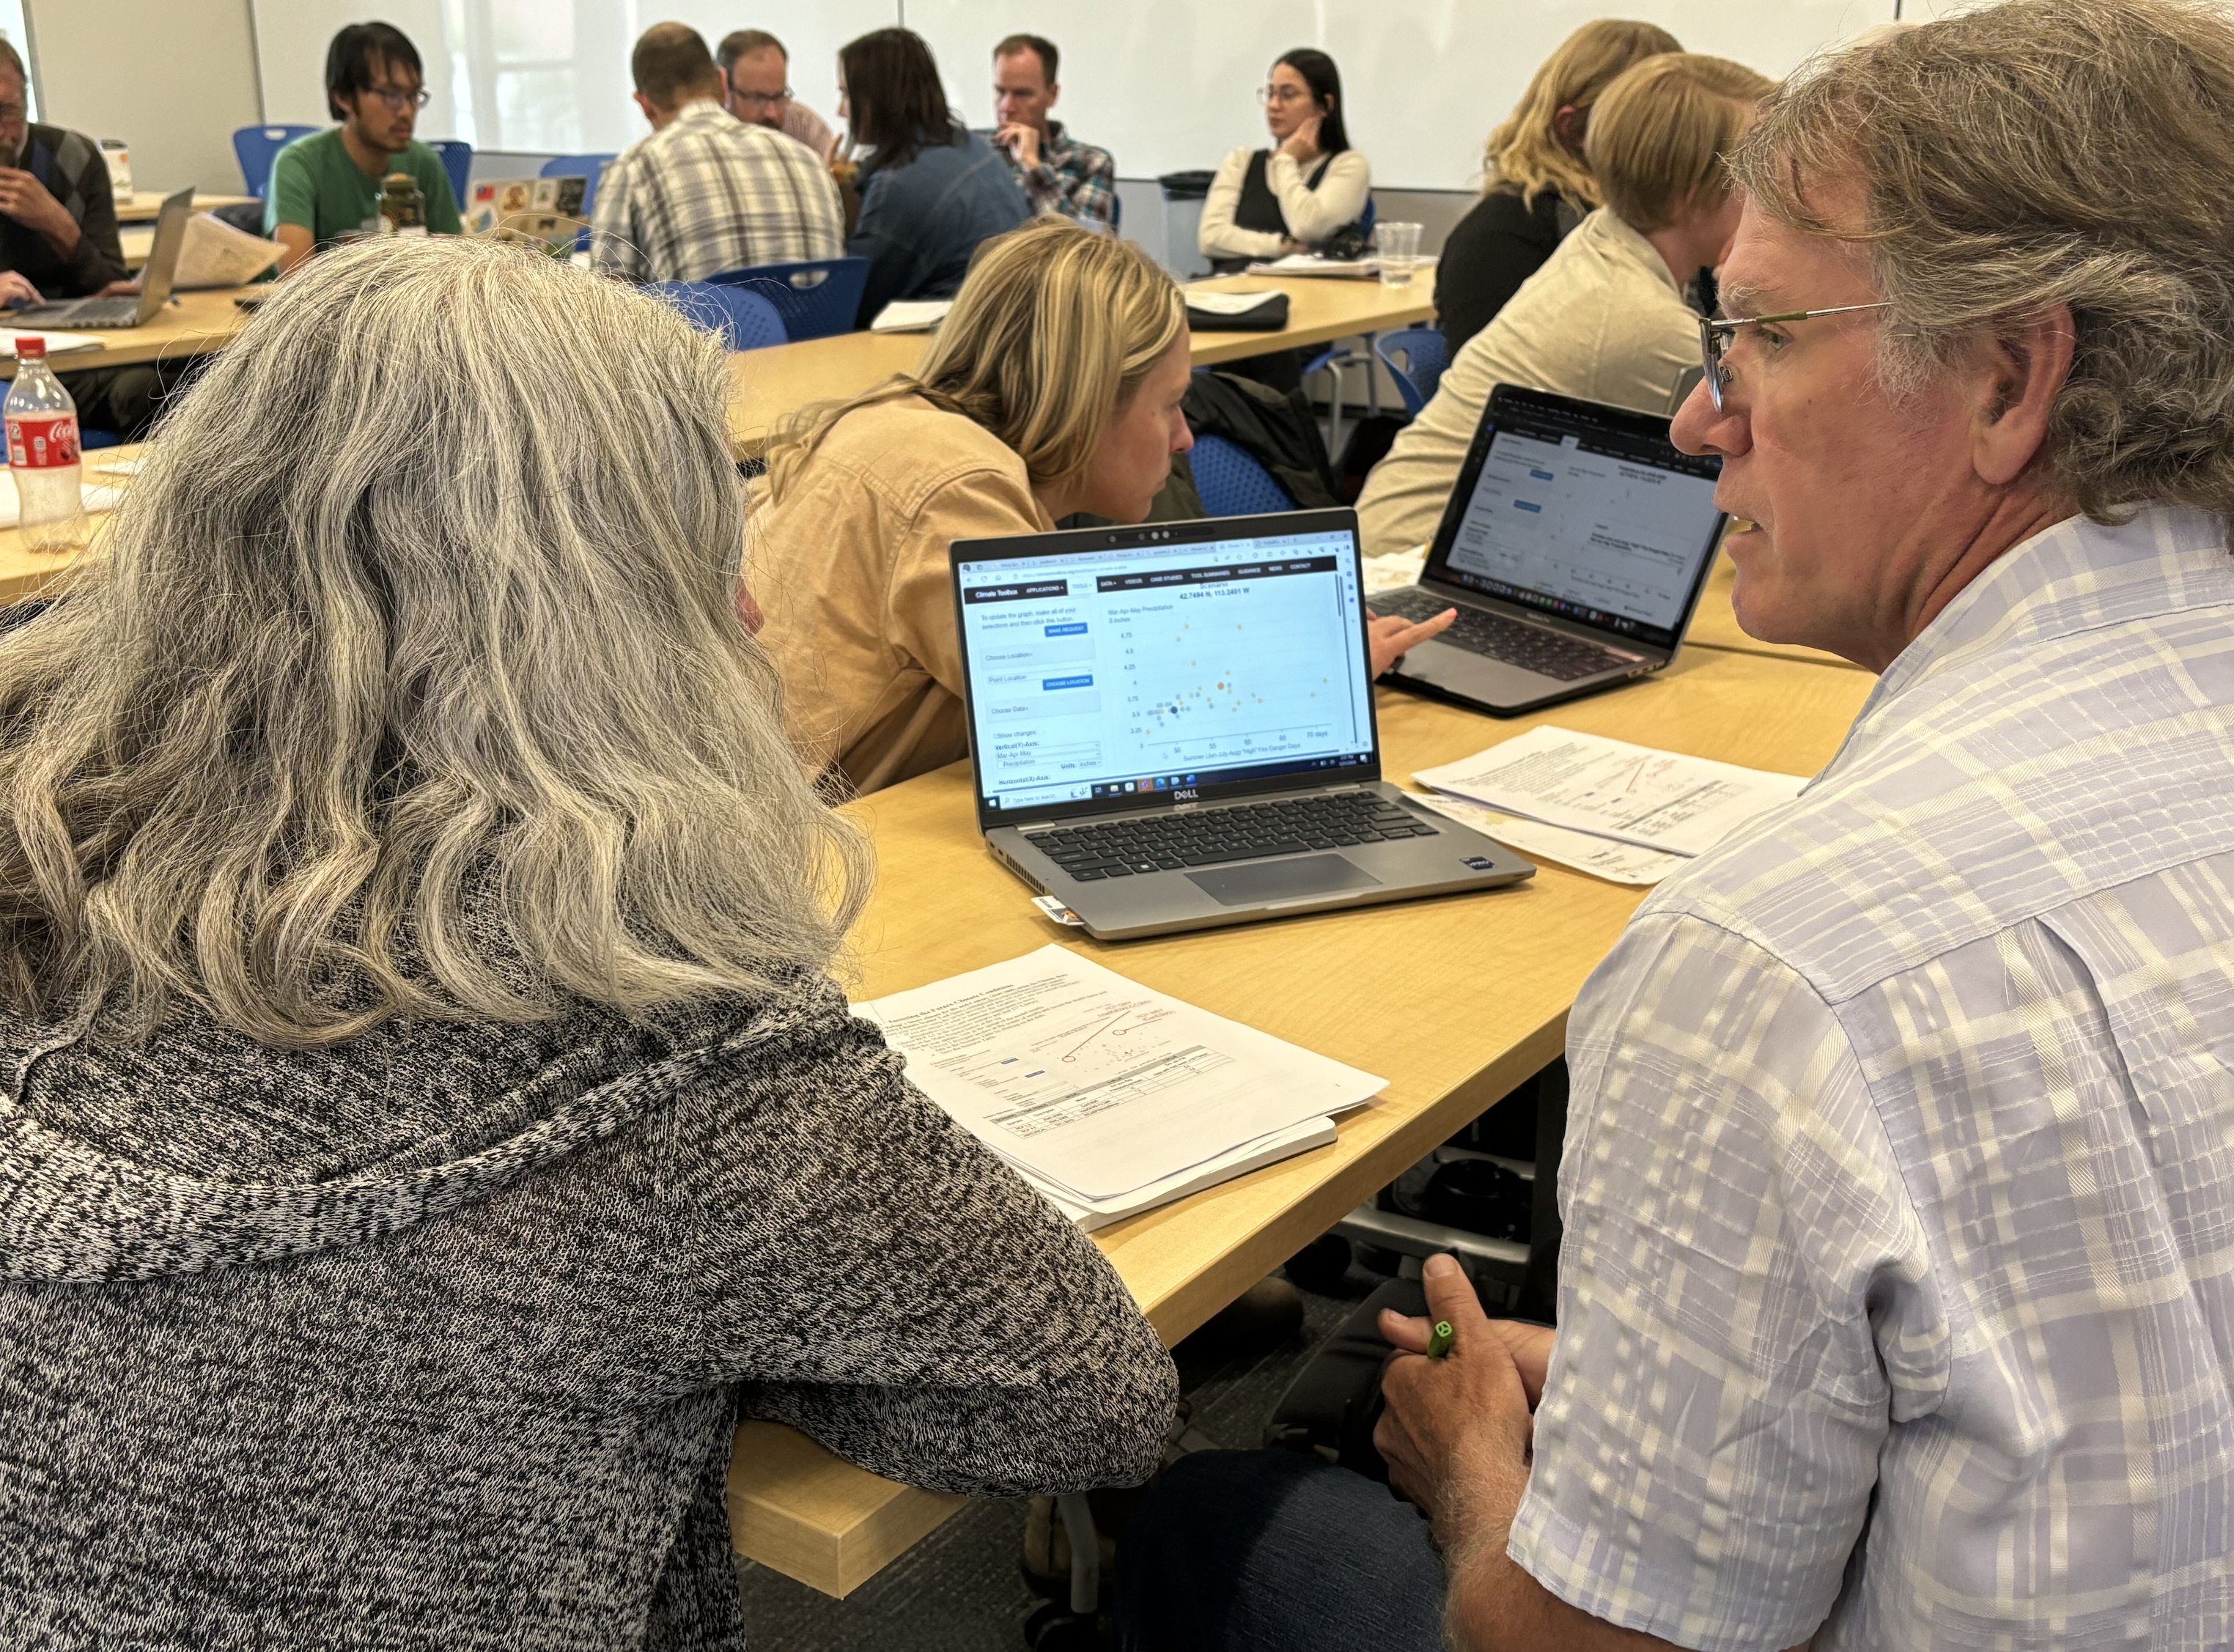
This workshop featured the Climate Toolbox amongst other tools.

The FWS Science Applications Program is working in partnership with multiple USGS Climate Adaptation Science Centers (CASCs), including the South Central CASC, Northwest CASC, North Central CASC, and Southwest CASC, and Boise State University, to develop a training series for sagebrush conservation practitioners.

These trainings began February 2024 with a self-paced introductory course, a series of virtual classrooms, and an in-person workshop in Boise, ID May 21-22 2024. This training series was open to the U.S. FWS Sagebrush Ecosystem Team, as well as others who work in sagebrush ecosystems.  

The Climate Toolbox was featured in the 90-minute online webinar, Introduction to Climate Tools, on April 30, 2024 and in the interactive hands-on exercises featuring tools in the Toolbox at the in-person workshop in Boise, ID on May 21-22, 2024. 

REGISTRATION AND INFORMATION
May 2024: CDA Community Group Finishes Study

CDA Report

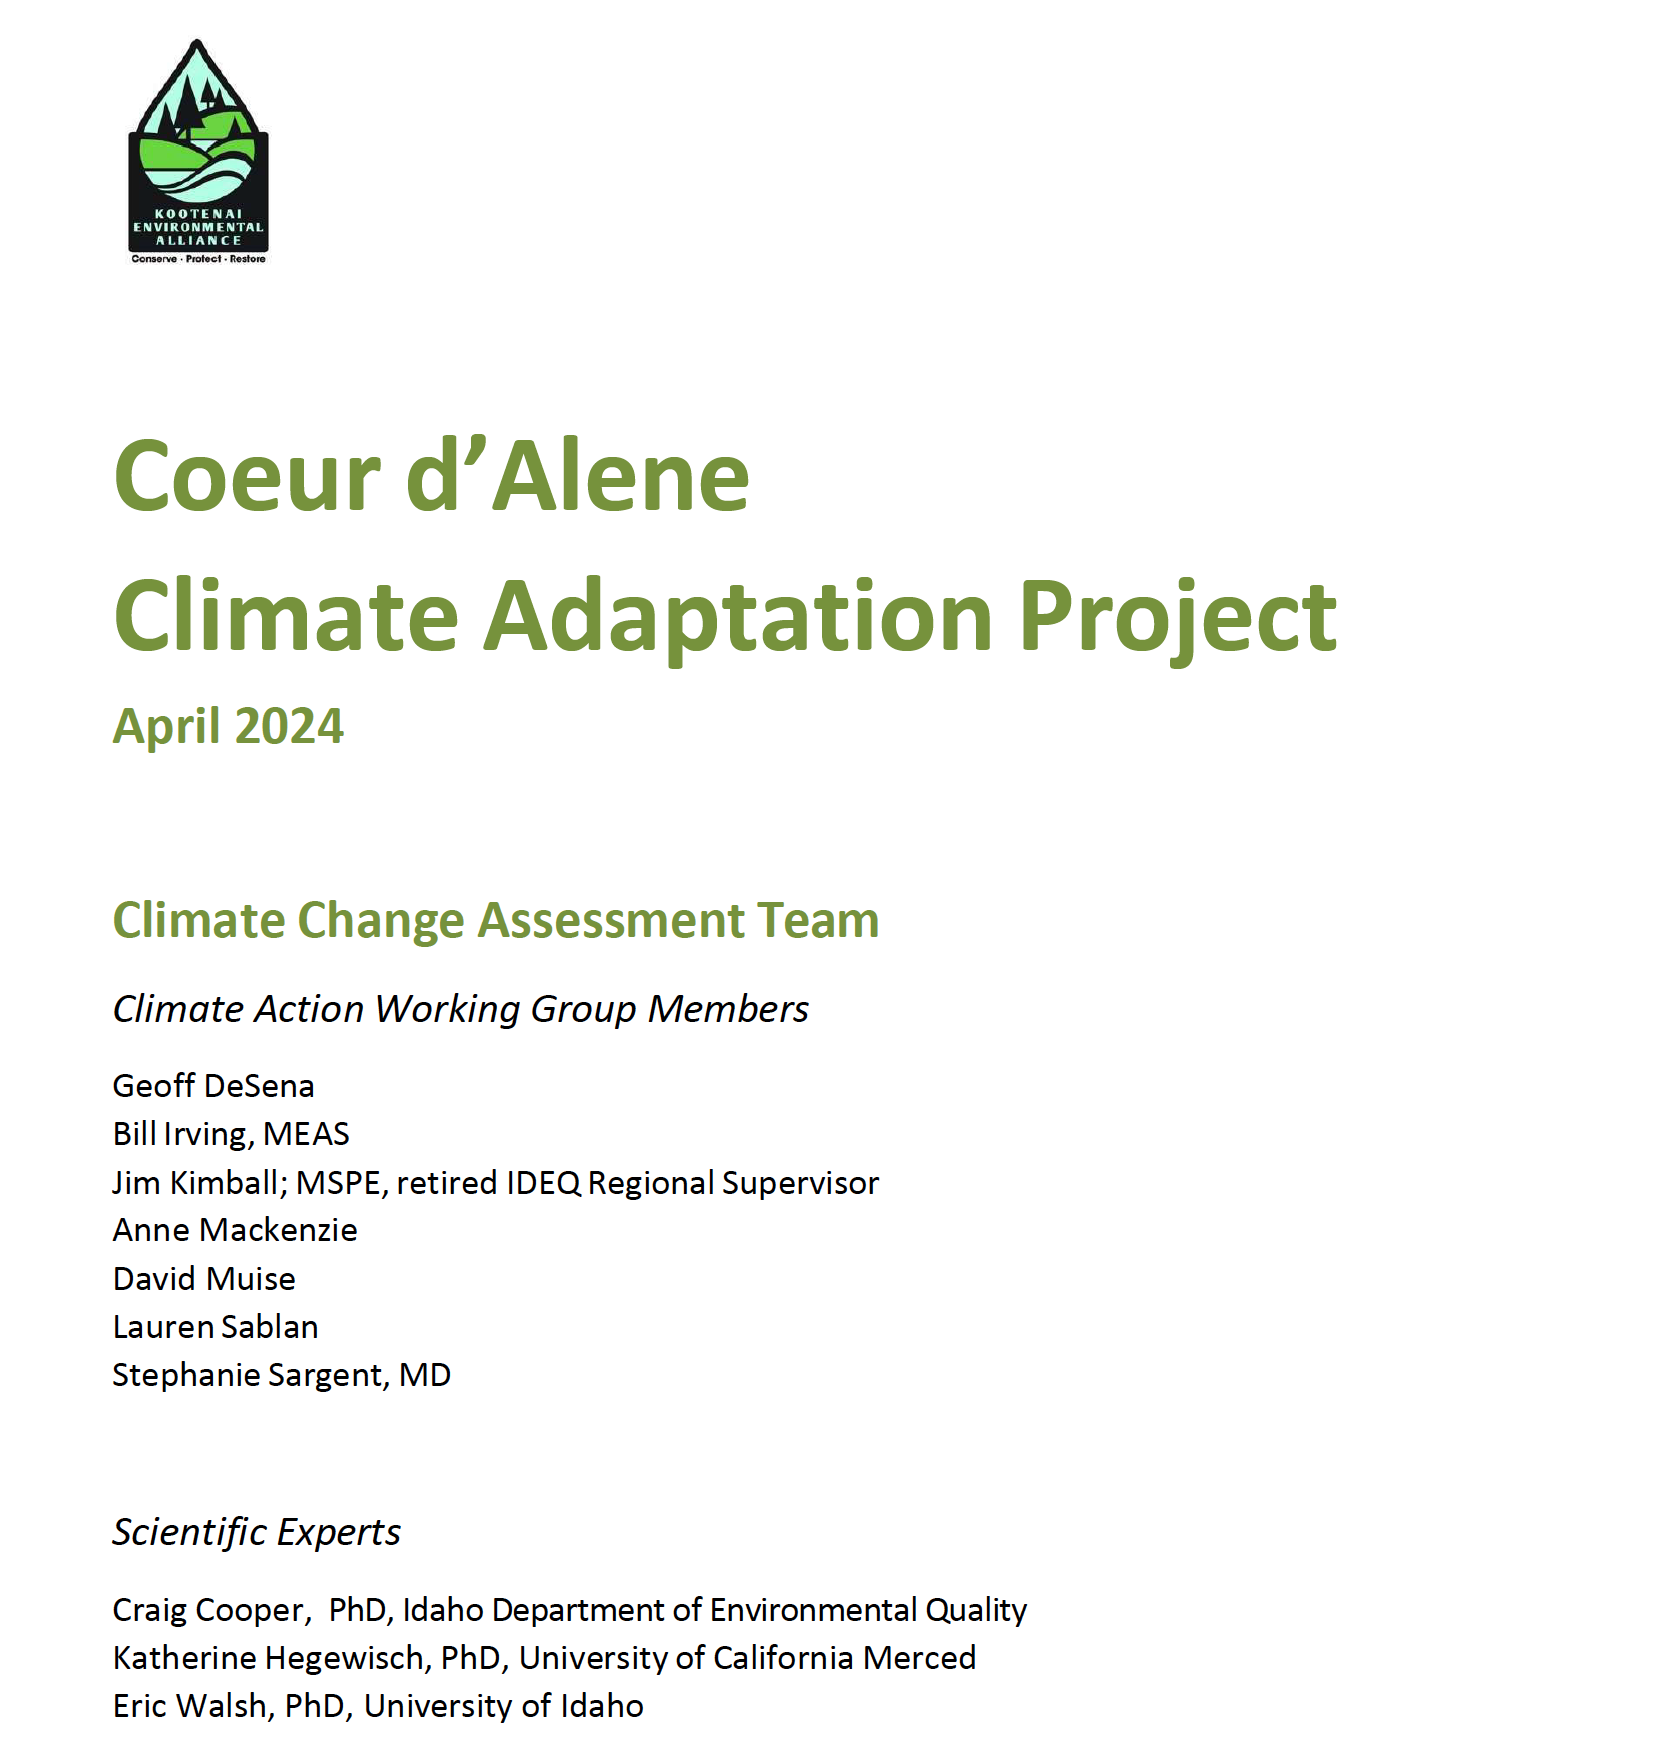
Coeur d'Alene Adaptation Project Releases Final Report & Will Present Findings at Local Conference

In 2020, community members in Coeur d'Alene, Idaho formed a group interested in climate impacts on the CdA lake and surrounding areas and what could be done. They called themselves the Couer d'Alene Adaptation Project (CCAP) and met regularly. They initially found inspiration from their neighbors in Spokane, Washington with the work of the Spokane Climate Adaptation Project . Both groups used the Climate Toolbox to draft an adaptation document as a start to thinking about future climate projections and projected impacts.   

The Coeur d'Alene Adaptation Project has now finalized and is publishing their adaptation report. Team members (Dave Muise, Craig Cooper and Bill Irving) will be giving a presentation at the 1st Annual North Idaho Green Summit held May 18, 2024 in Coeur d'Alene, ID. This event is sponsored by the Kootenai Environmental Alliance (KEA).

The KEA will continue the work for climate action in the region with the KEA Climate Action committee

See Report (PDF)


Apr 2024: NC CASC Webinar

NC CASC APR 2024 Webinar


North Central Climate Adaptation Science Center Webinar

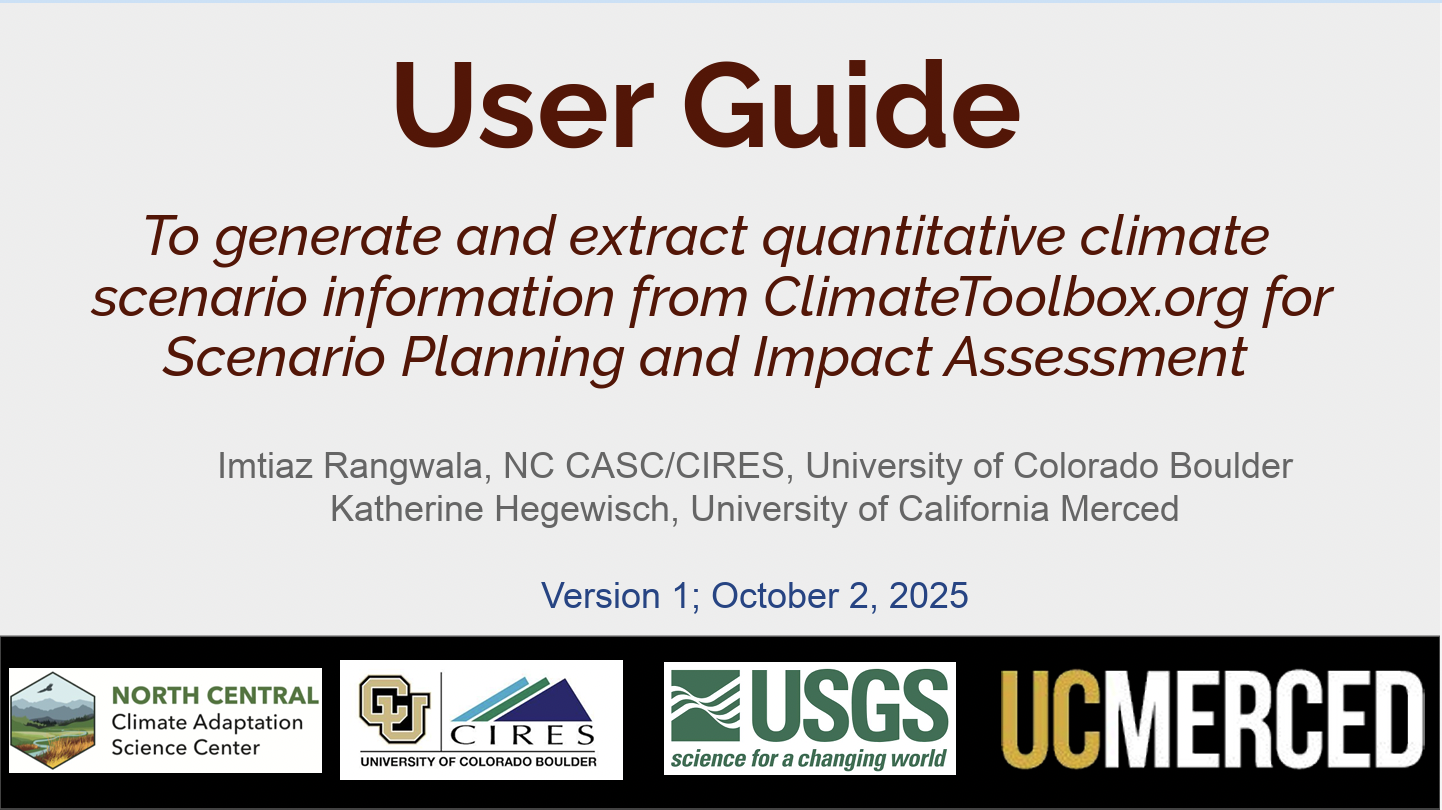
In April 2024, Katherine Hegewisch, Imtiaz Rangwala and John Guinotte presented a webinar entitled 'ClimateToolbox.Org: A Discussion of Climate Applications to Support Quantitative Climate Change Impact Assessment and Scenario Planning'. 

 Recent years have seen great advances in the availability of downscaled climate data and tools to inform climate change impact or vulnerability assessments and climate adaptation planning. This presentation will discuss various tools available through https://ClimateToolbox.ORG to access downscaled future climate projections relevant for ecological applications, examine future climate uncertainty and develop quantitative information to inform scenario planning activities. We will specifically discuss the Future Climate Scenarios tool and an updated version of the Future Climate Scatter tool, which are the latest additions/improvements to the toolbox motivated by the ongoing collaboration between North Central CASC and US Fish & Wildlife Service to inform Species Status Assessments. These tools and the underlying climate and hydrological projections data can collectively support a wide array of applications for developing quantitative information to support climate adaptation and scenario planning.

SEE RECORDING

Feb 2024: Natural Resources Workshop in Kansas

Kansas Workshop

Climate Workshop at 2024 Kansas Natural Resources Conference

At the 2024 Kansas Natural Resources Conference in Manhattan, KS on Feb 8, 2024, there was a 4-hr workshop entitled 'Using Climate Data to Achieve your Natural Resources Objective'.

As part of this workshop, Christy Miller Hested (North Central Climate Adaptation Science Center) led a 1-hr hands-on climate lesson, 'Applications of the Climate Toolbox for Resource Management', which provided an overview of the Climate Toolbox and its climate data and had participants use the Climate Analogs tool to tell future data stories around the Tall Grass National Prairie in Kansas.

Christy worked with Climate Toolbox developer Katherine Hegewisch to develop the workshop. For the workshop,  Christy adapted the Future Temperatures 2-pager in the Climate Toolbox Workshop Series to look at the future of the Tall Grass Prairie through climate analogs.


Jan 2024: What's New in the Toolbox

Recent additions to the Toolbox:

  • Annual summary data for growing degree days, last spring freeze, first fall freeze and growing season length, heating degree days and chilling degree days were updated for all years 1979-2023 consistent with the current state of the gridMET database in the Historical Climate Tracker and Historical Climate Scatter tools.  
  • Annual summary data for chill metrics was added to the Historical Climate Tracker tool. These are in beta, so we welcome any feedback on these. 
  • Grids for the gridded data in each tool can now be shown by clicking a button under the location setter. This should be available in just about every single tool. 

Jul 2023: What's New in the Toolbox

Recent additions to the Toolbox:

  • Custom area-averaging- users can now either draw a polygon or choose a polygon from an uploaded shapefile to be used for area-averaging of data for some of the tools. Currently, this is only available in the Future Climate Scatter tool, the Future Boxplots tool and the Future Climate Scenarios tool... but we will be putting this option in most of the graphing tools soon. 
  • Customing colors in the Future Timeseries tool - the ability to change the colors on the graph has been added to the Future Timeseries tool. Just click the 'Change Graph' settings on the right of the tool to open the settings for modifying the colors.
  • Activity Series - a new Climate Toolbox Activity Series has been added to the toolbox in six lessons on climate impacts. 
  • A new Historical Drought Recovery tool - a new tool has been added the to the Toolbox. The Historical Drought Recovery tool allows you to create a map of the probabilities of recovery from drought. 

June 2023: What's New in the Toolbox

Recent additions to the Toolbox:

  • Future Climate Scenarios tool - a new tool has been added to the Toolbox. The Future Climate Scenarios tool allows you to create a table of climate projections with many different metrics and future scenarios. 
  • Future VPD  - vapor pressure deficit projections have been added to the Future Boxplots and Future Scatter tools.
  • Future hydrology projections  - a new hydrology dataset (MWBM by Hostetler & Alder which utilizes MACAv2-METDATA) has been added to the following tools: Climate Mapper, Climate Scenarios, Future Boxplots and Future Scatter.  This dataset has metrics of runoff, snow water equivalent, soil moisture and climatic water deficit at 1/24-deg over the contiguous USA.
  • Future climate scatter - a new feature has been added to the existing Future Climate Scatter tool that allows you to record information about clicked scatter points into a table. Open the 'Scenario Table Result' window in this tool to get started. 
  • Area averaging - area averaged data is available for most location based tools now where the area averages can be chosen from rectangular regions, US counties, US HUC8 watersheds and US states. There are more improvements coming soon for area averaging.
  • Educational Assignment - three assignments that utilize the Climate Toolbox for university teaching have been added. See Guidance
  • Video Training Series  - a series of training videos on the Climate Toolbox have been added to a YouTube channel. See Videos.